COGS & Margins
See whether every product, customer, and model is actually profitable. Aforo splits provider cost into AI inference, infrastructure, and gateway fees, sets it against revenue at every grain — down to the individual event — and lets you cap spend and alert on thin margins.
You shipped an AI feature. It works. Now the only question that matters is the one your finance team will ask first: is it making money? COGS & Margins answers that for every product, customer, and model — and tells you which of them is quietly losing money on every call before the monthly invoice does.
Where it lives#
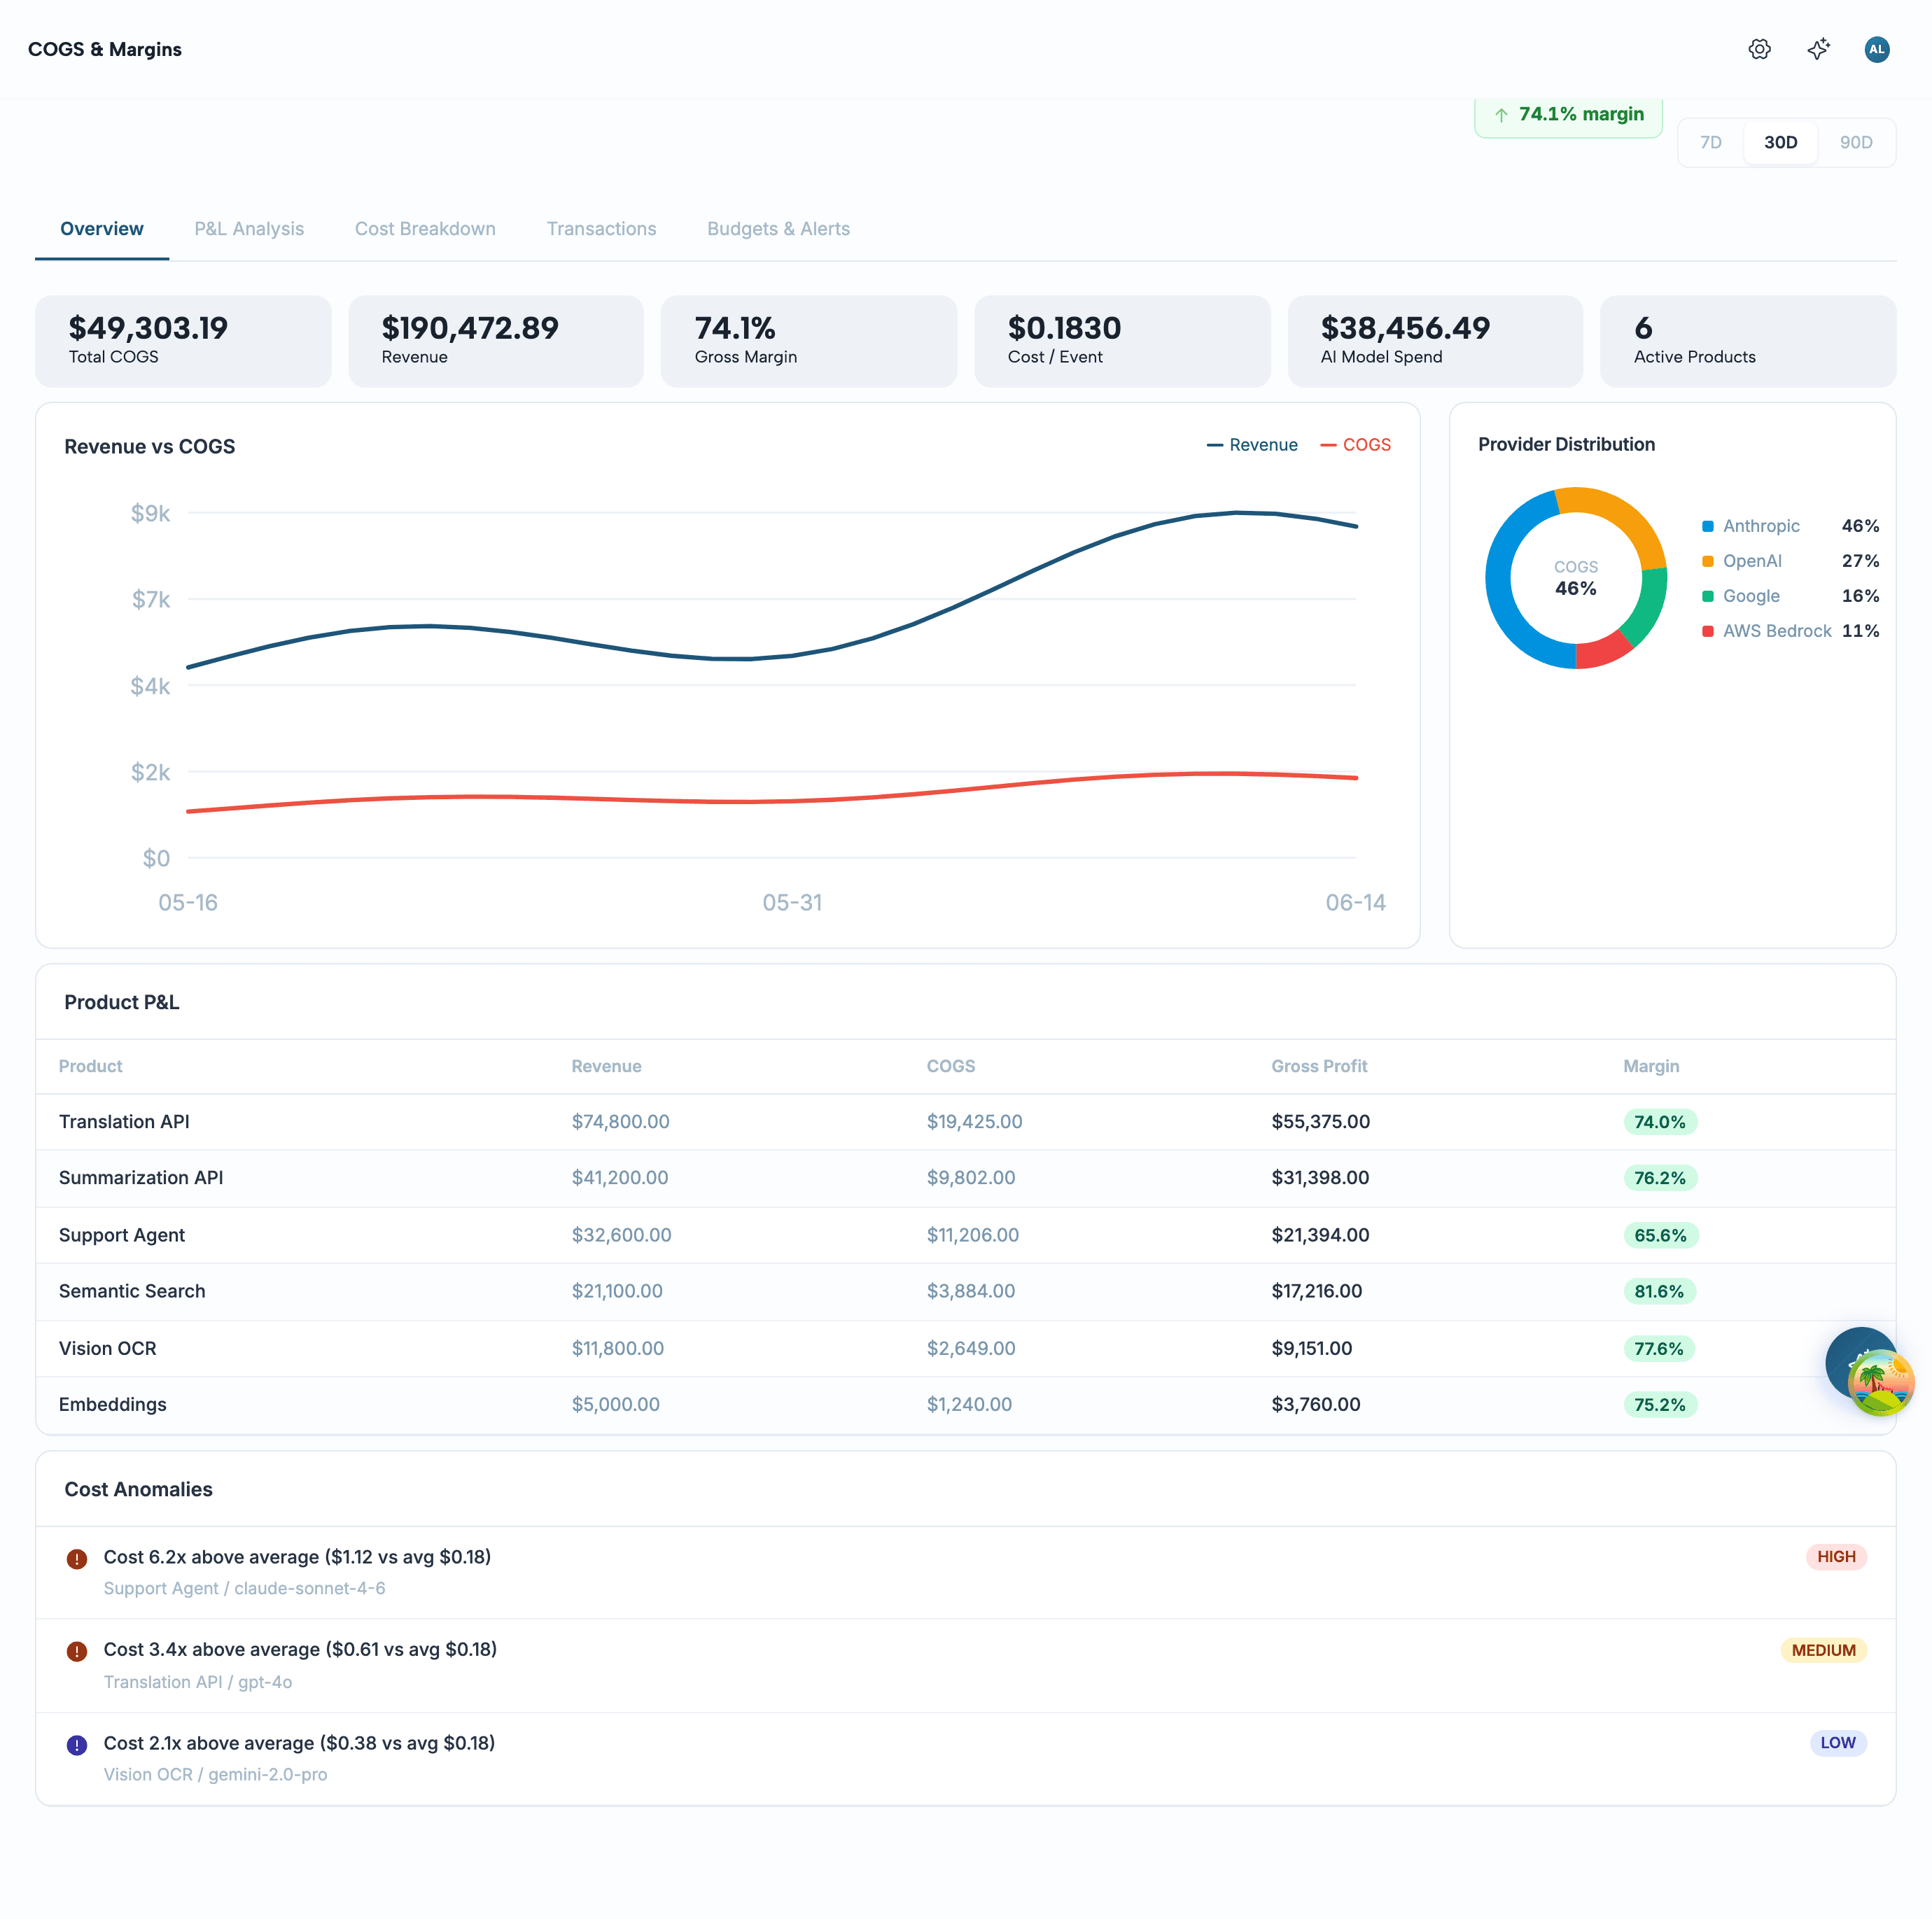
Open the Aforo console and go to Intelligence → COGS & Margins. The page is built from five tabs, and a period selector (7D / 30D / 90D) in the top-right re-scopes all of them at once.
How cost is computed#
Every metered event arrives carrying the provider cost it incurred. Aforo doesn't treat that as one opaque number — it splits each event's cost into three buckets the moment it's ingested:
Revenue is attributed separately. Each event is matched back to the invoice line items it contributed to, so the revenue you see next to a cost is the revenue that cost actually earned — not a blended average. This is what lets COGS & Margins compute a true margin per event rather than a tenant-wide ratio.
The metrics, defined#
Six numbers sit at the top of the Overview tab. Here is exactly how each one is calculated — no rounding surprises, no hidden weighting.
Every breakdown on the page — by provider, product, customer, or model — re-applies the same margin formula at that grain. A product's margin is its own revenue minus its own cost; a customer's margin is theirs alone. The numbers reconcile upward: the per-product P&L sums to the headline Total COGS.
Profitability, ranked#
The P&L Analysis tab turns the headline margin into a ranked list — the answer to “which product earns its keep, and which customer do we serve at a loss?” The unit-economics cards up top report average cost, revenue, and margin per event; the tables below rank every product and every customer by their own P&L.
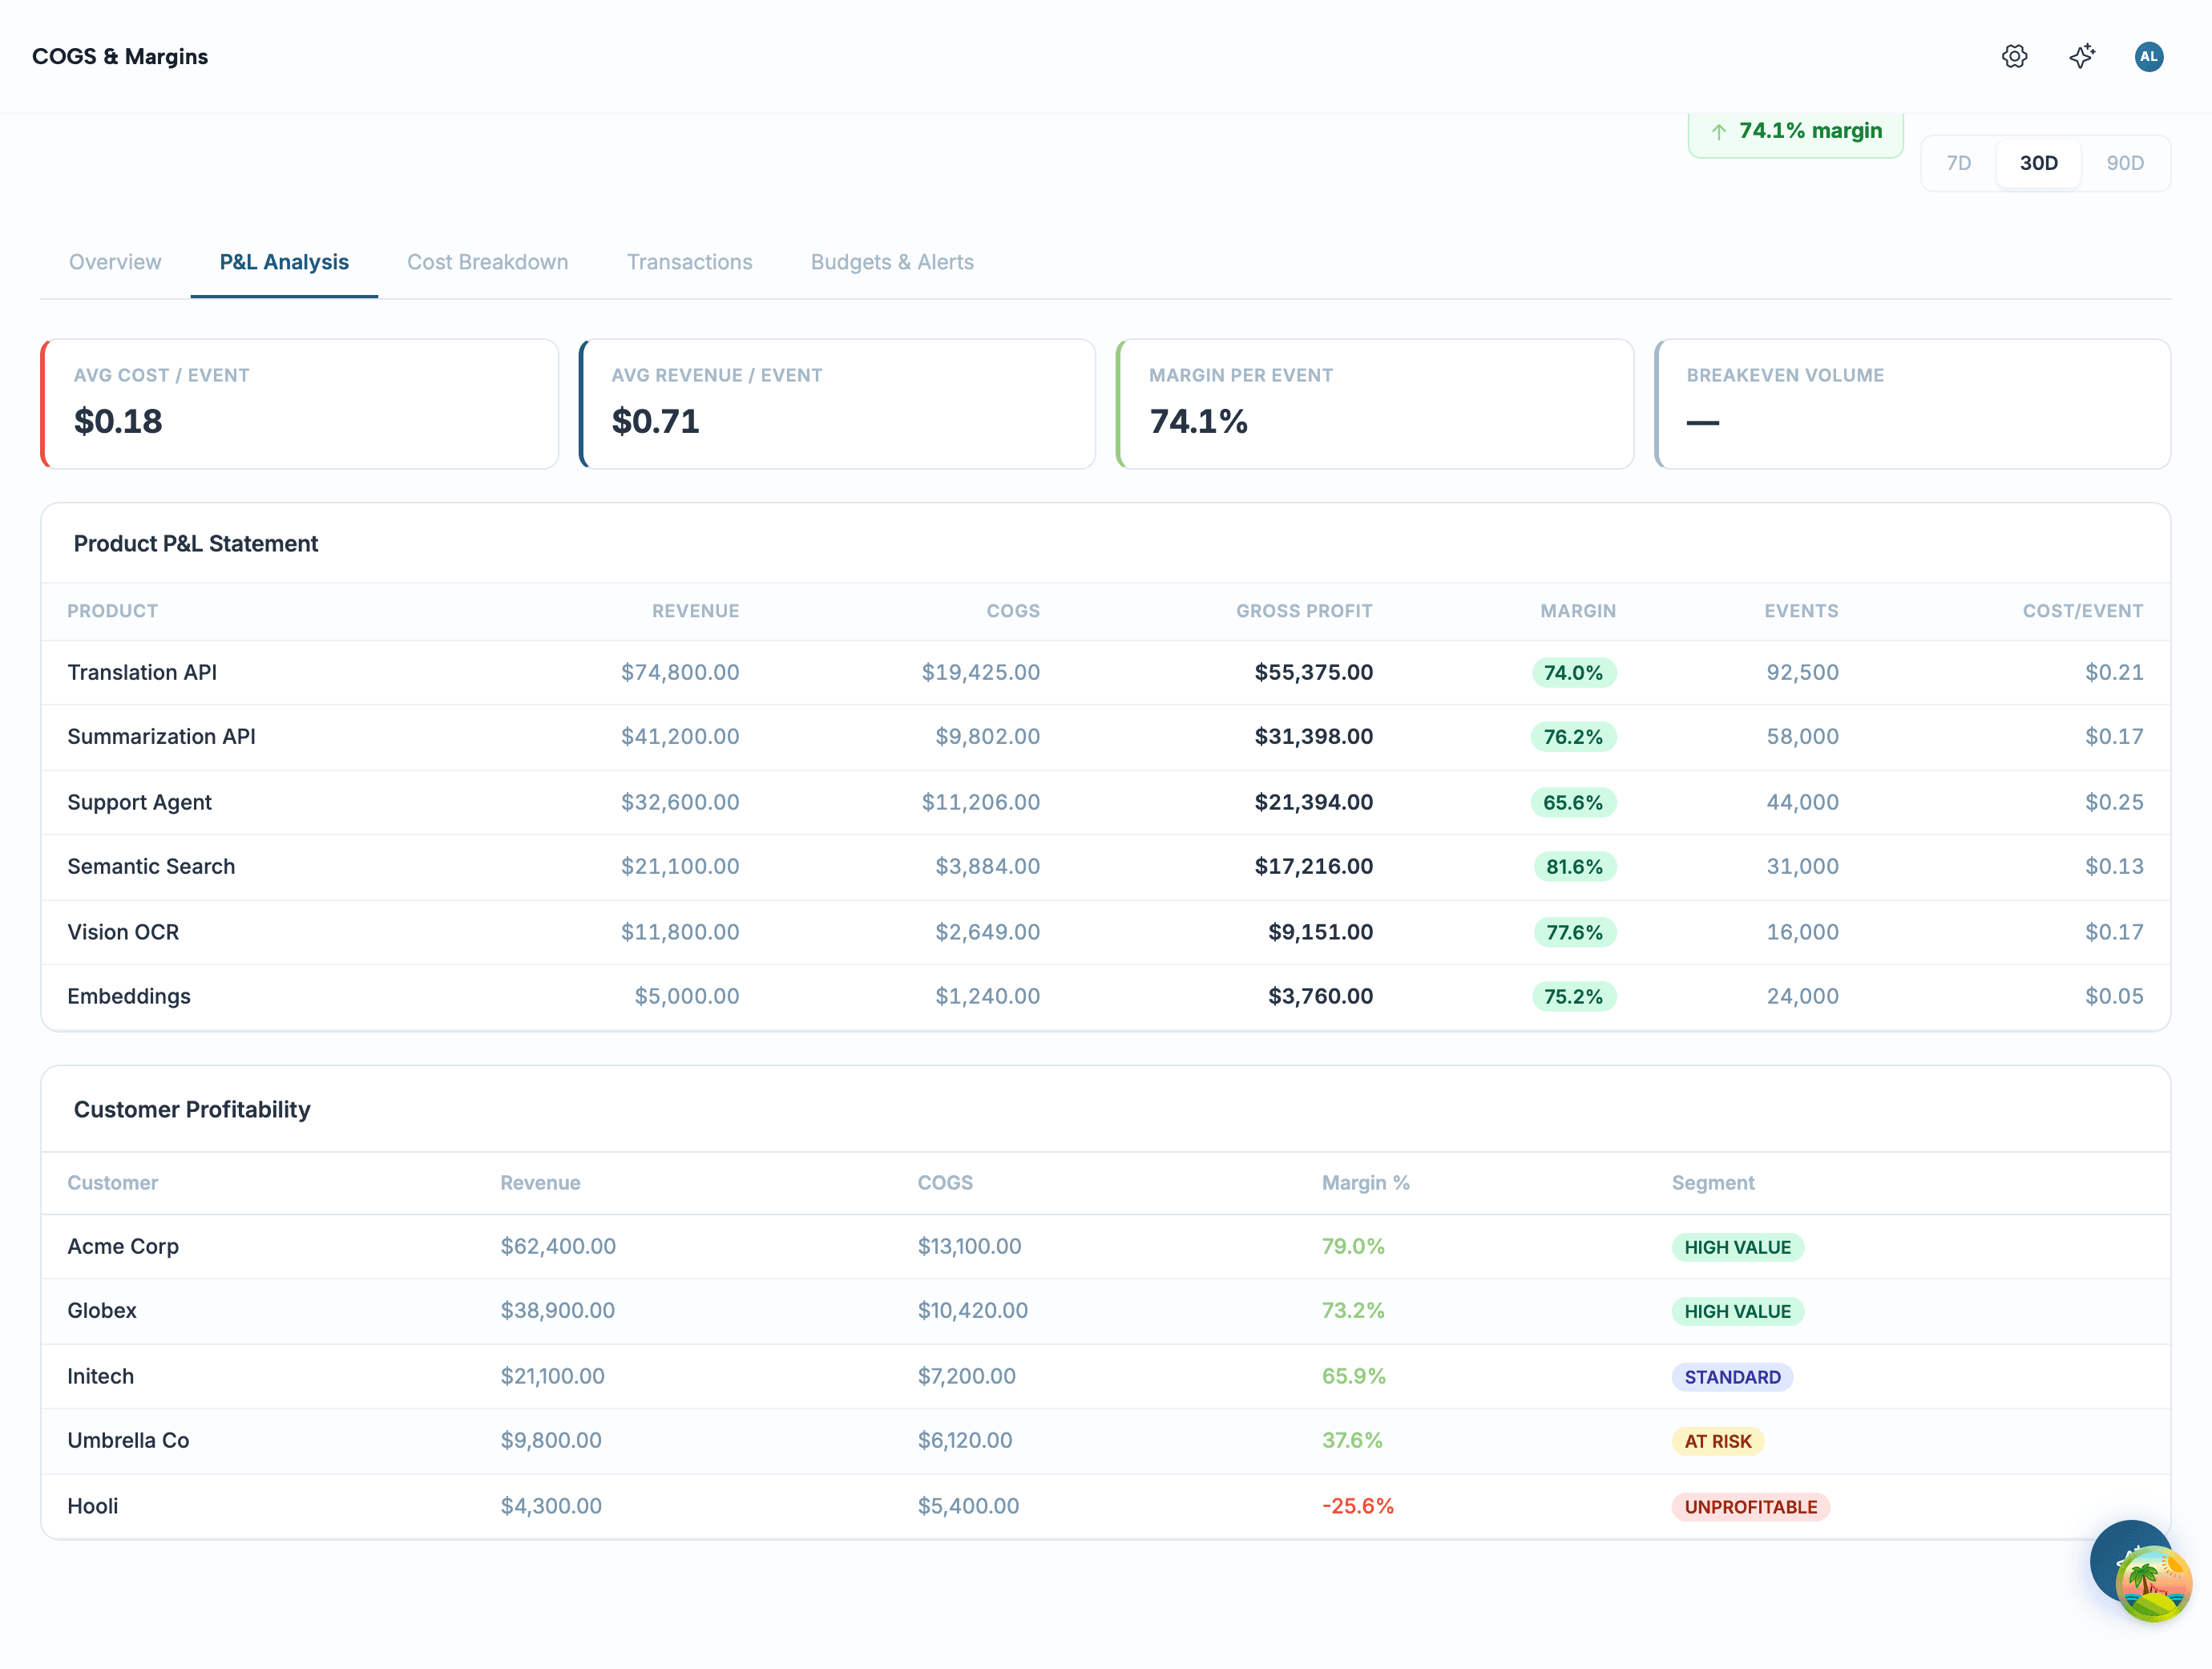
This is the view that earns its place in a pricing review. A product can look fine in aggregate while one customer on a legacy rate runs a negative margin on every call — here that customer shows up tagged Unprofitable, with the exact revenue and cost behind the number. Take that to the account team, or set a floor with .
Cost composition#
The Cost Breakdown tab opens with the composition bar — the single most useful view for a cost conversation, because it answers “where is the money going?” in one glance.
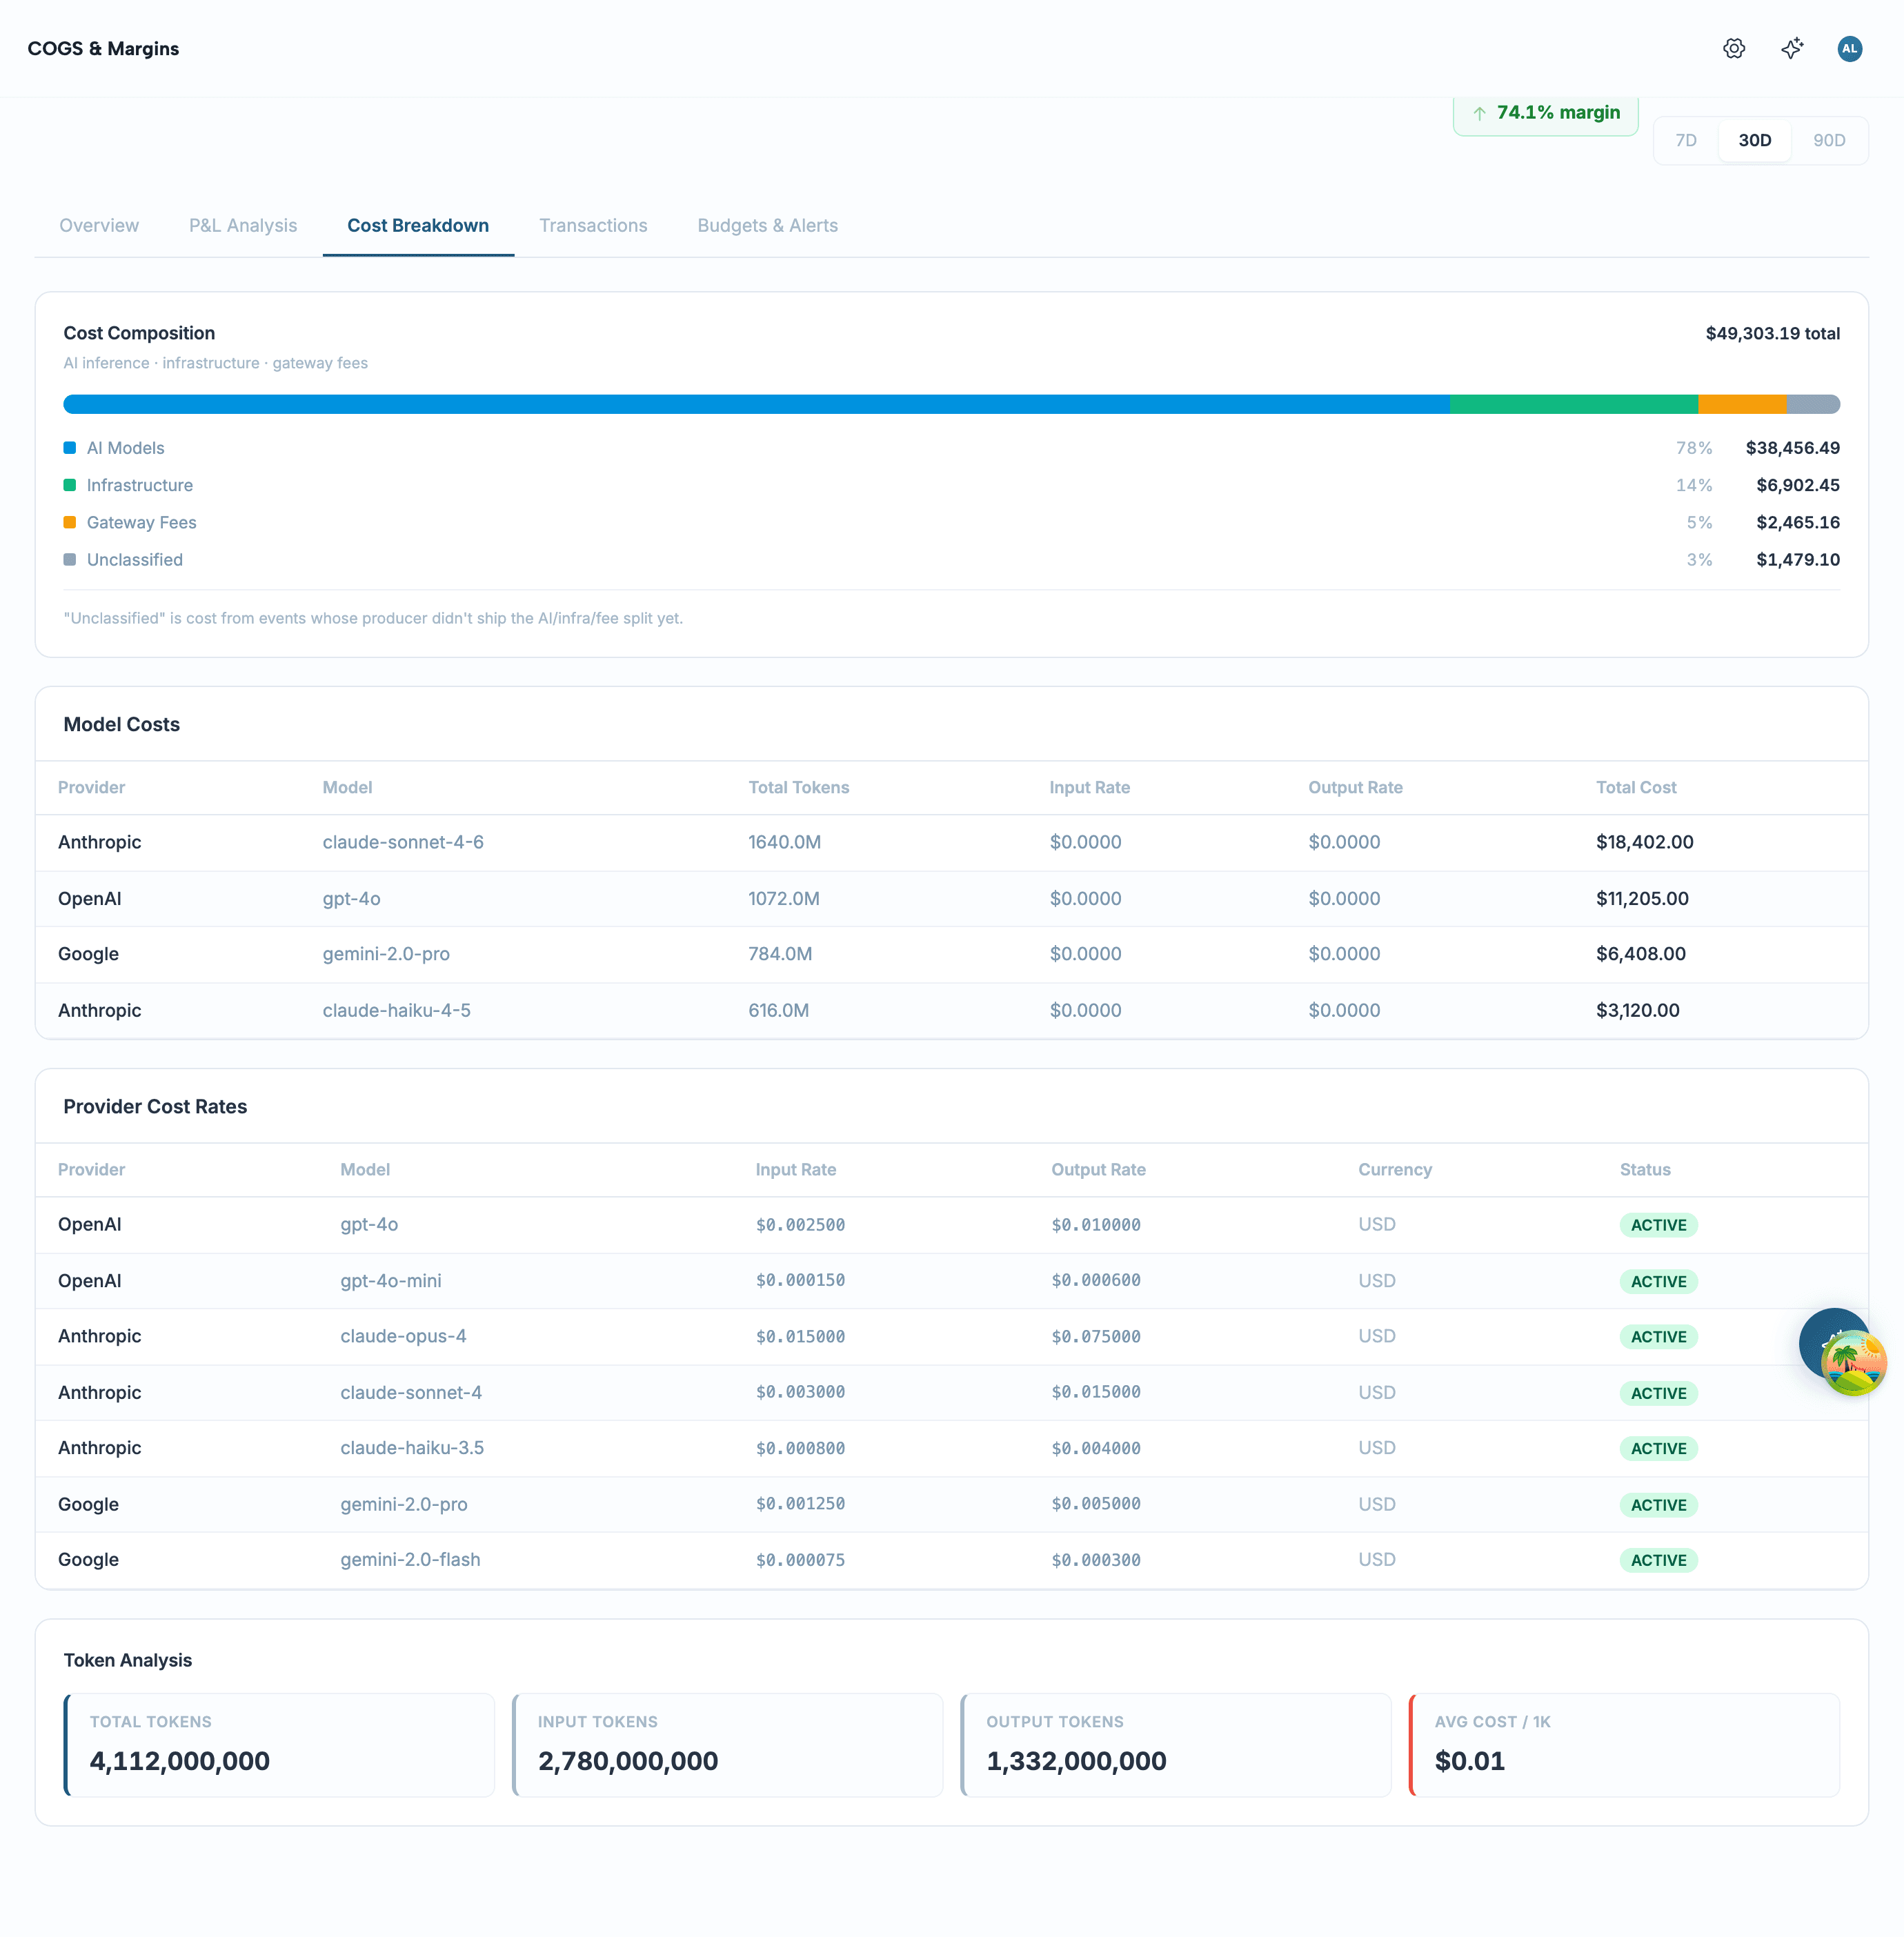
You'll often see a fourth segment: Unclassified. That's cost from events whose producer hasn't yet shipped the AI / infra / fee split — the total is correct, but the breakdown couldn't place it in a bucket. It's shown explicitly rather than silently folded into “AI”, so the composition you read is honest about what it knows.
Breakdowns & token analysis#
Below the composition bar, the same period is sliced four ways so you can find the specific thing that's expensive:
- By provider — which vendor (Anthropic, OpenAI, Google, AWS Bedrock) you spend the most with.
- By model — total tokens, input/output rate, and total cost per model, so a pricey model hiding behind a cheap average shows up.
- By product — cost and margin per product, ranked.
- By customer — who you serve at a loss, and who carries the book.
The Token Analysis card rolls up total tokens, the input/output split, and average cost per 1K tokens. For token-billed models this is the number to watch: when output tokens climb faster than revenue, margin is eroding even while usage “looks fine.”
The transaction ledger#
Aggregates are where you start; the ledger is where you settle an argument. The Transactions tab lists every metered event with its own cost, revenue, and margin — filterable by product and provider, and paginated so a busy tenant doesn't pull a million rows at once.
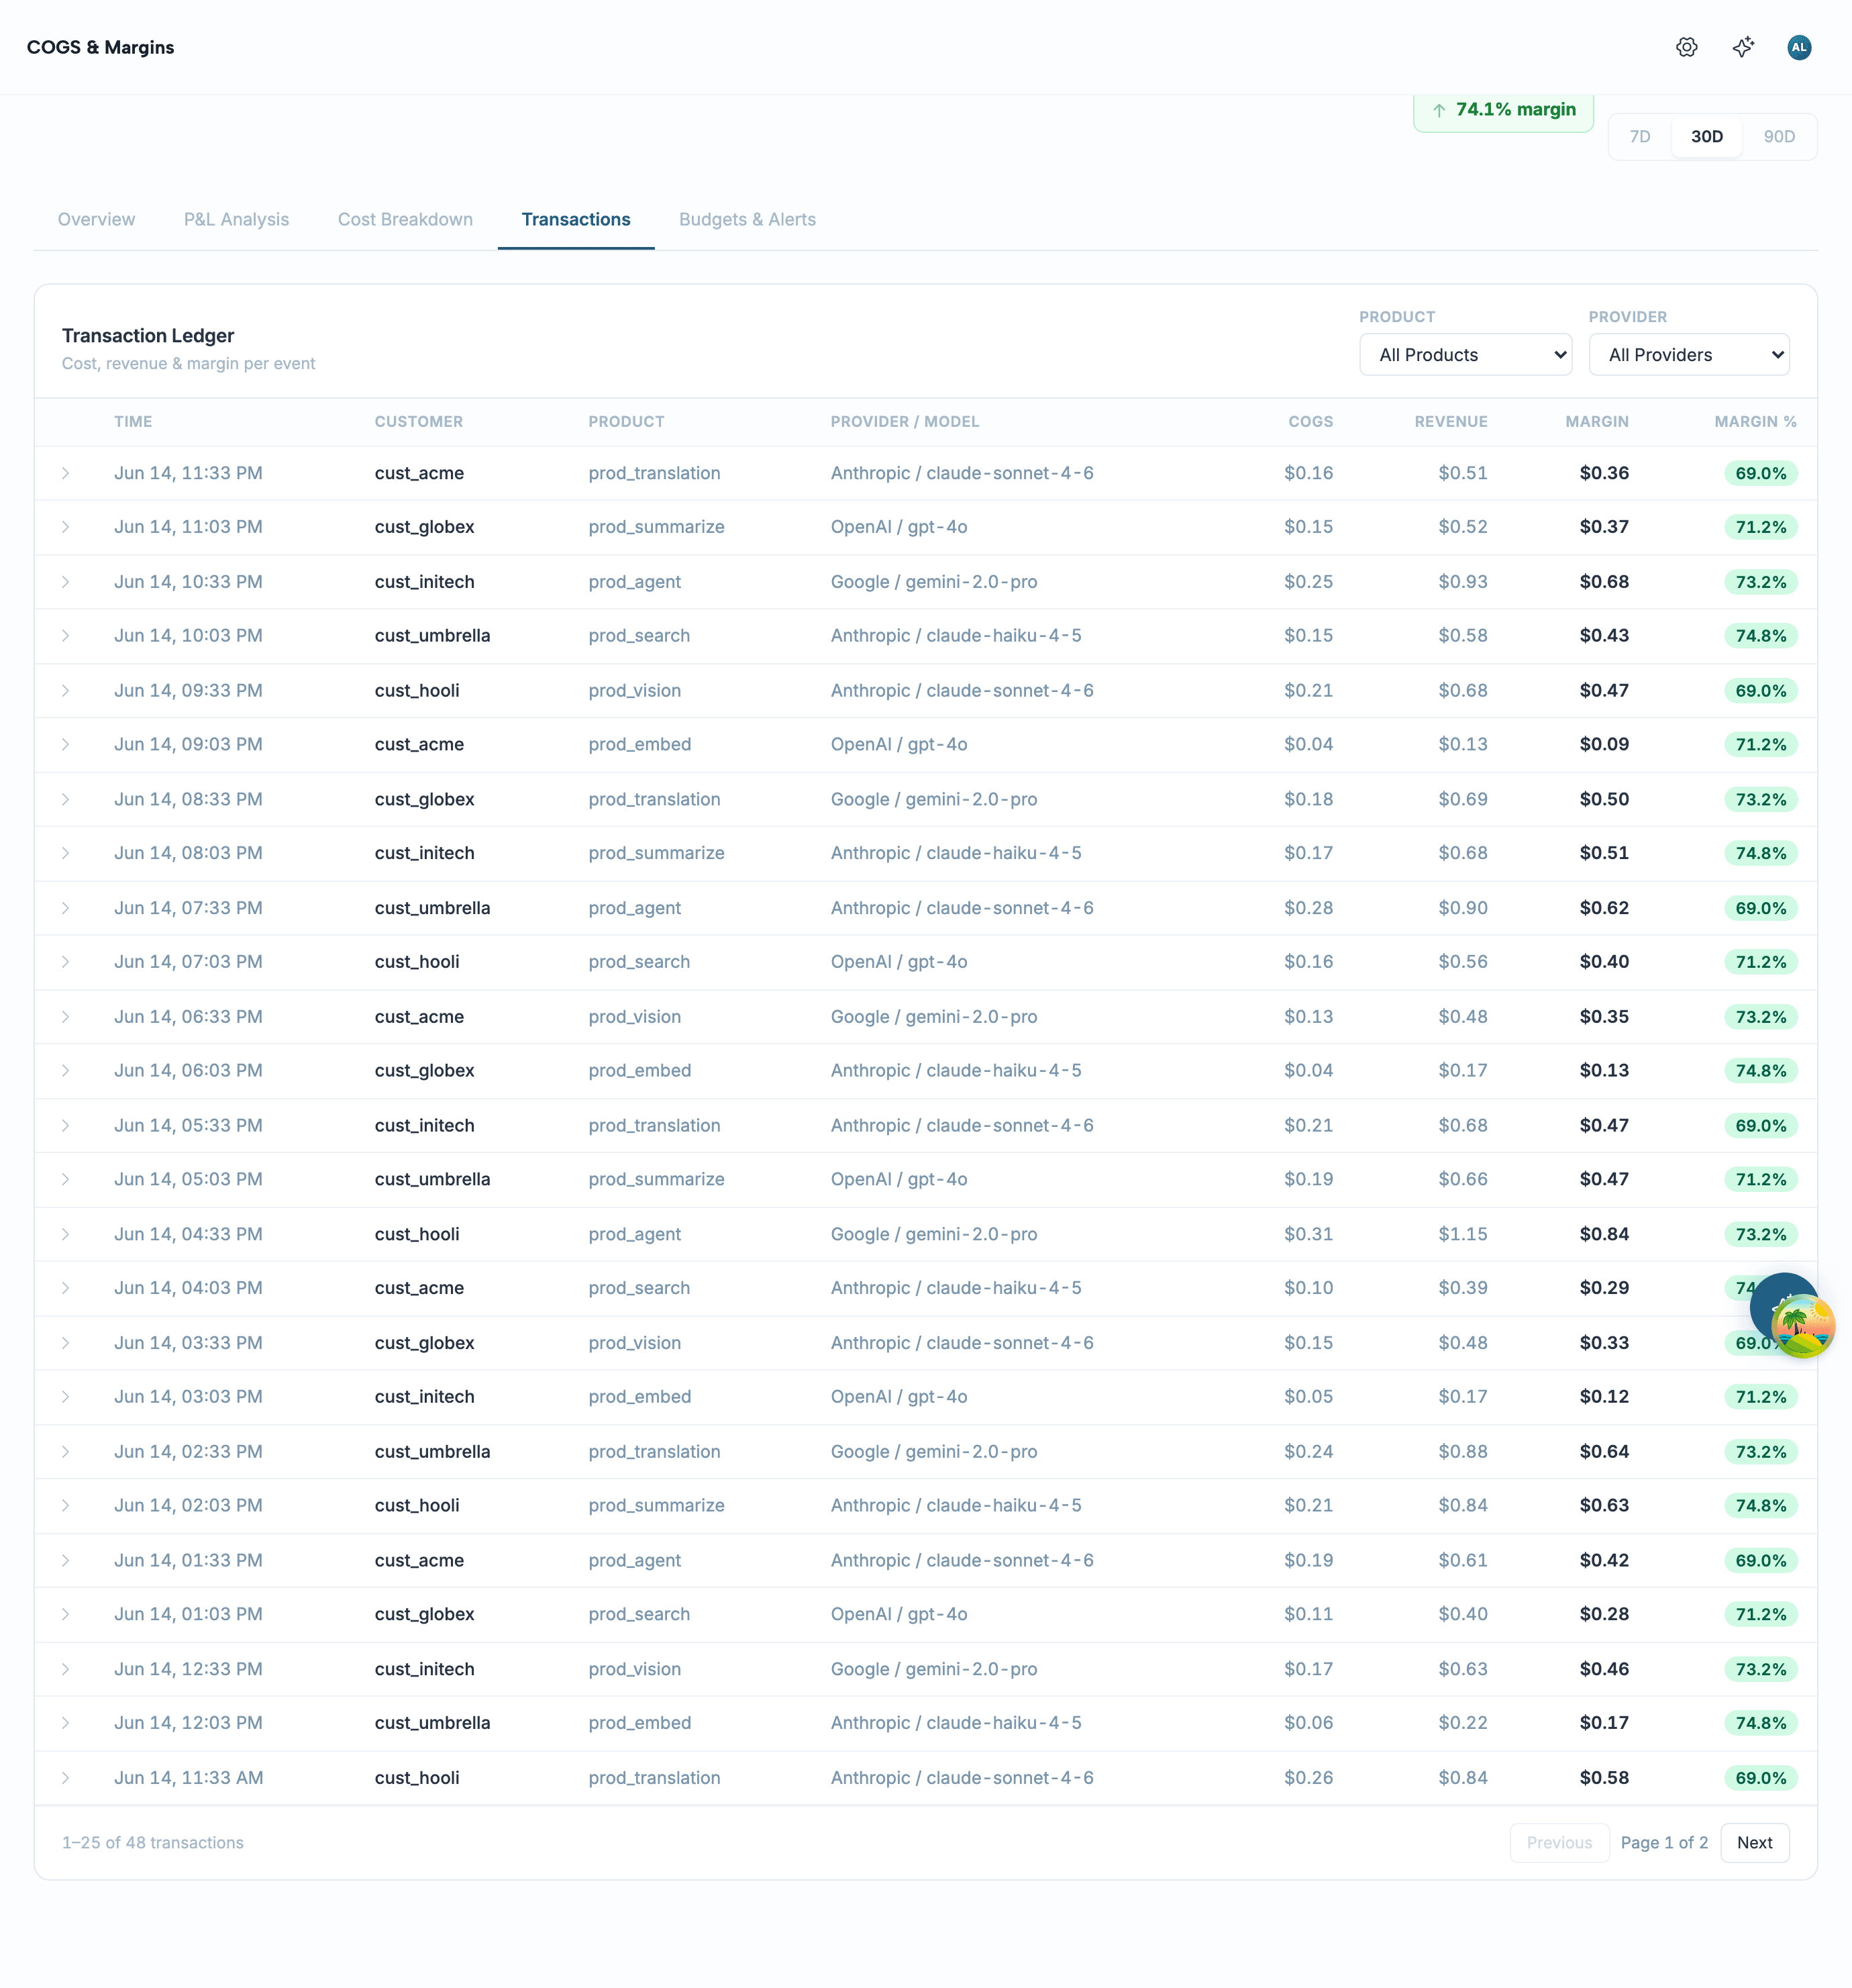
Margin on each row is derived from that row's own numbers — margin = revenue − cost, and margin % = margin / revenue when revenue is present. Expand a row to see the same AI / infra / fee decomposition that drives the composition bar, scoped to that single event. When the by-product table says a product's margin slipped, this is where you confirm which calls did it.
Pull the data via API#
Everything the dashboard renders is read from the same tenant-scoped endpoints, so you can pipe COGS into your own BI, a finance close, or a Slack digest without screen-scraping. Authenticate with your Aforo bearer token and send your X-Tenant-Id; the data returned is always scoped to that tenant.
All read endpoints accept from and to ISO-8601 dates (defaulting to the last 30 days). The transactions endpoint adds optional productId, customerId, and provider filters plus page / size (size is capped at 200). Here's a page of the ledger:
The response is a standard page envelope. Each row is one event with cost, the revenue it earned, the derived margin, and the AI / infra / fee split:
The overview and cost-composition endpoints return a single object rather than a page. Composition, for example, is the four buckets plus the total:
OWNER, ADMIN, BILLING_ADMIN, DEVELOPER, or VIEWER. A token without one of these roles gets a 403, not an empty page, so a misconfigured service account fails loudly.Budgets & alerts#
Observing margin is half the job; the other half is being told when it slips without watching a dashboard. The Budgets & Alerts tab handles both.
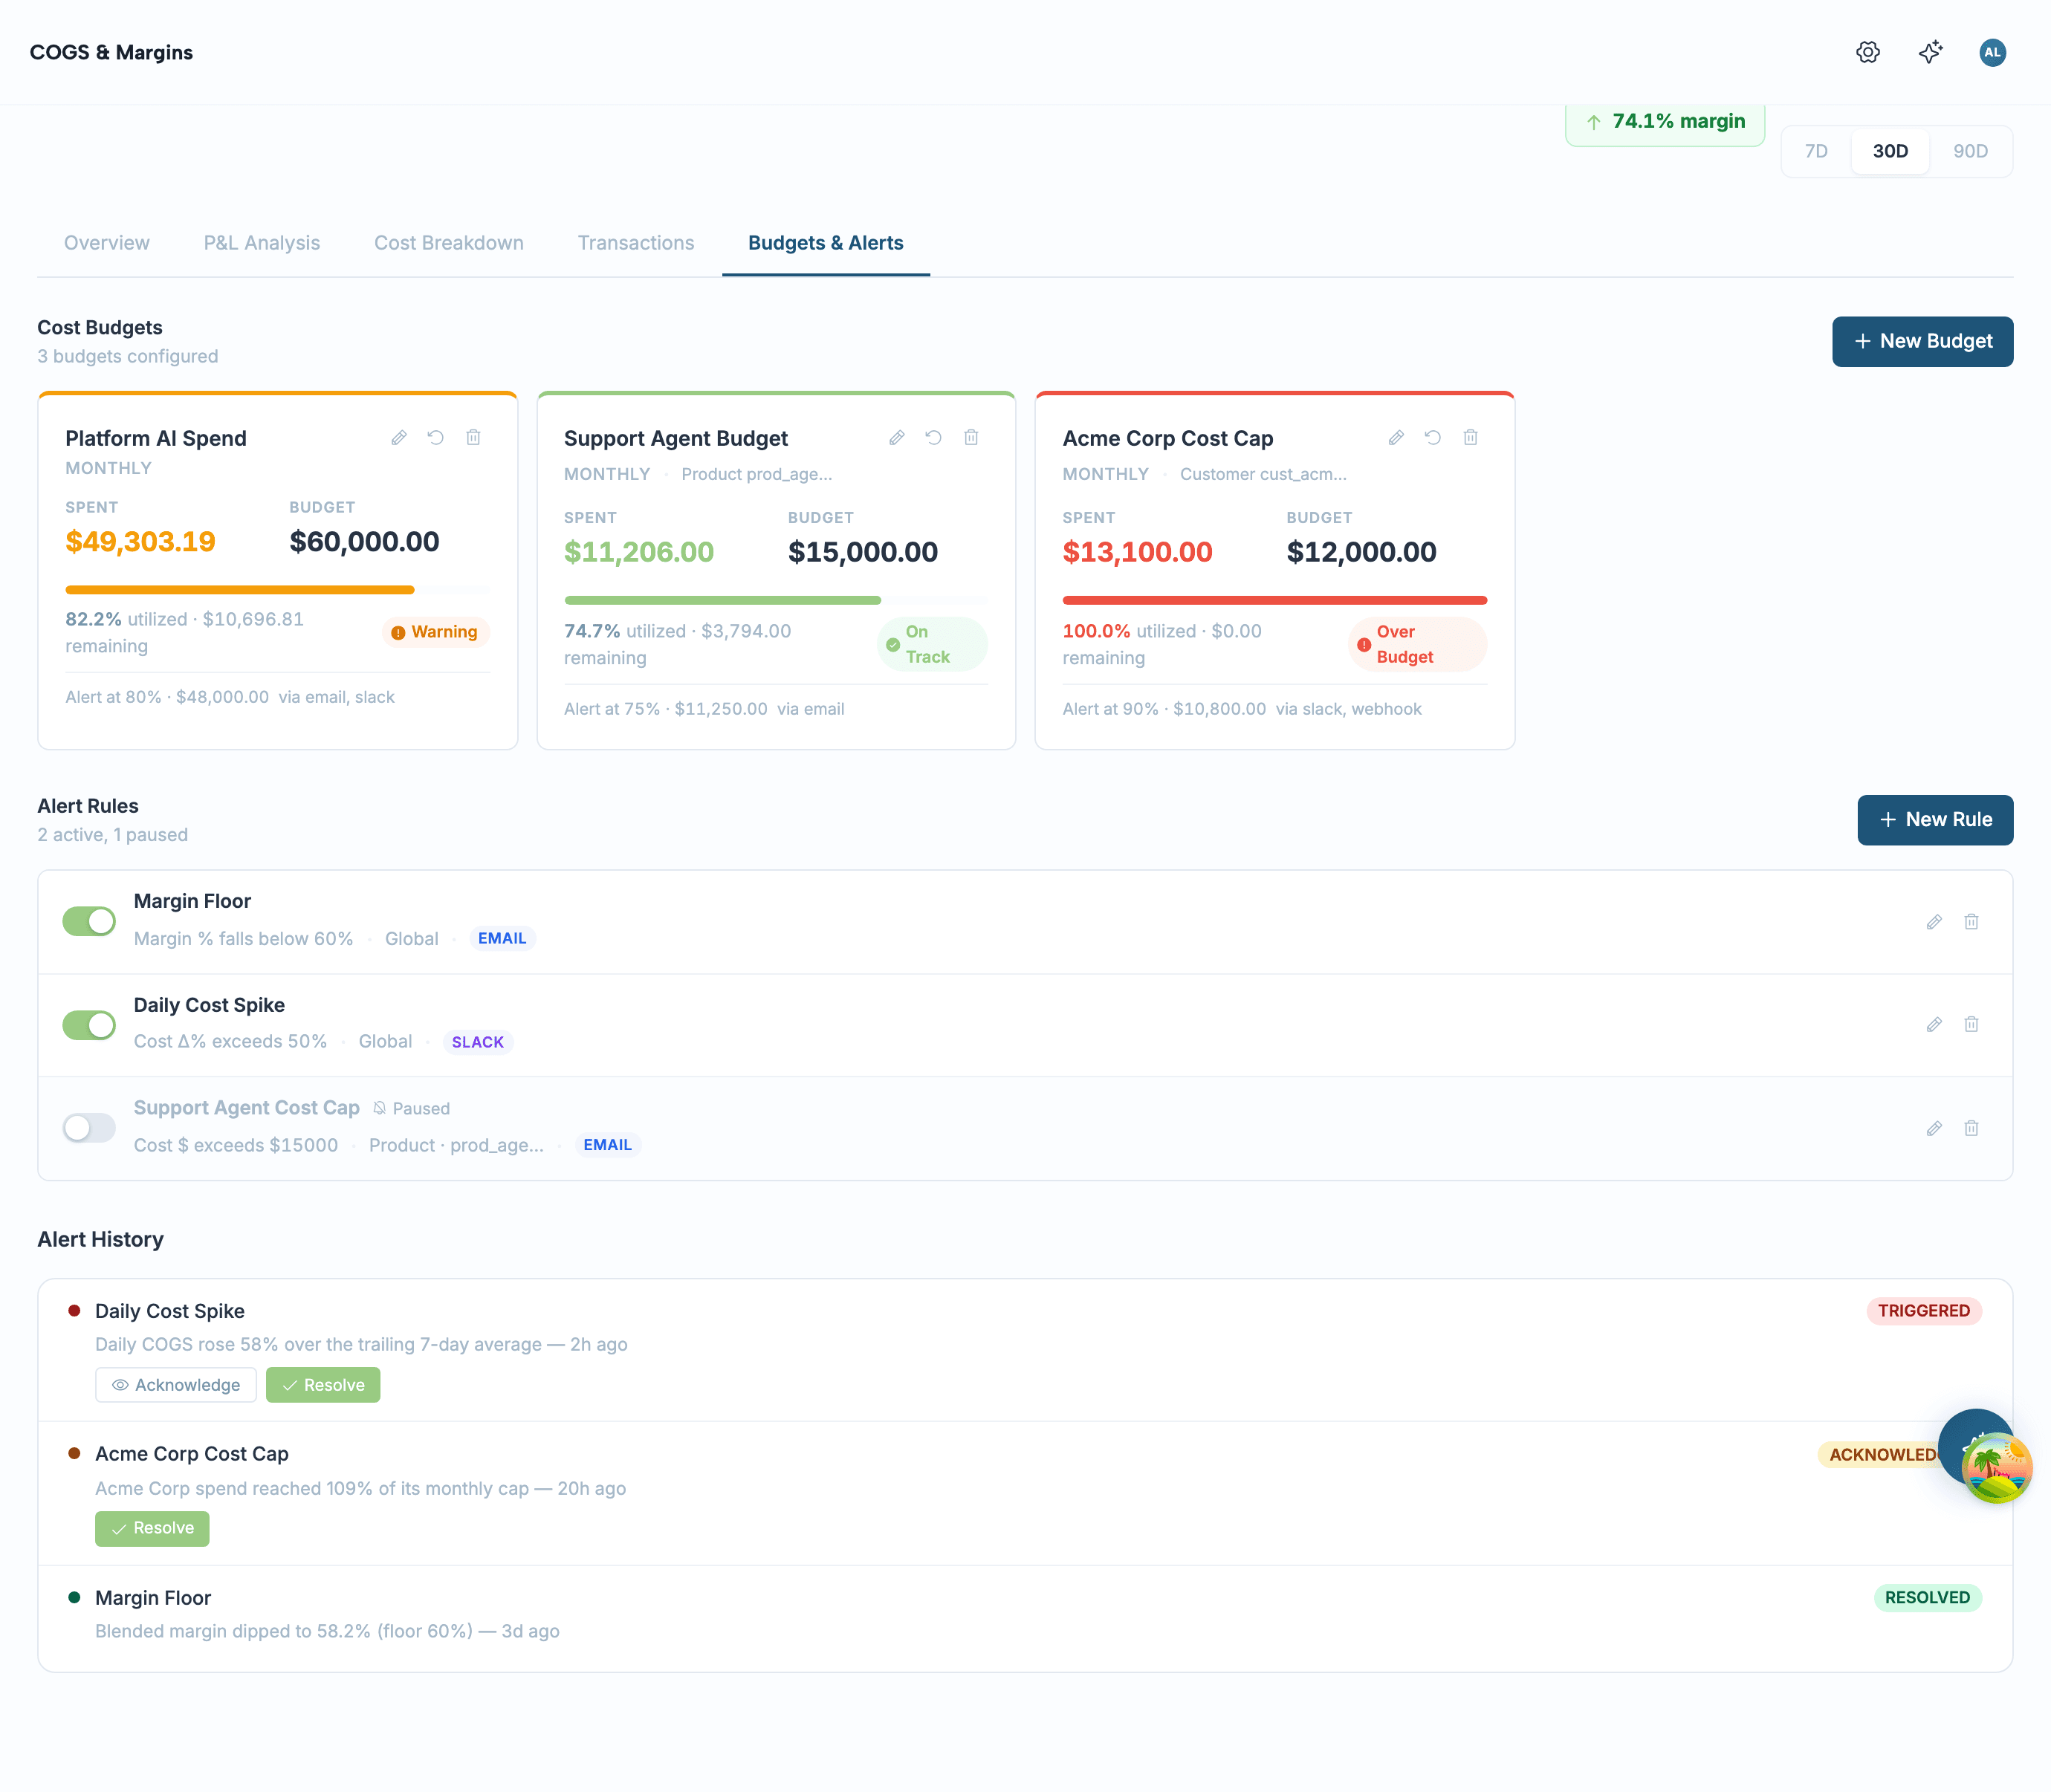
Cost budgets#
A budget is a spend ceiling for a period — MONTHLY, QUARTERLY, or ANNUAL — optionally scoped to one product or customer. Each card shows spent-versus-cap with a burn-down bar and a status: On Track, Warning once it crosses the alert threshold, or Over Budget at 100%. Manage them at /api/v1/cogs/budgets.
Alert rules#
A rule fires when a metric crosses a threshold. Pick the metric — COST, MARGIN, or RATIO — a comparison, a threshold, and a delivery channel (EMAIL or SLACK). A “margin floor” rule, for instance, fires the moment blended margin drops below 60%. Rules live at /api/v1/cogs/alert-rules; every firing is recorded at /api/v1/cogs/alert-history with acknowledge and resolve states so an alert can't be silently lost.
COGS & Margins vs Margin Guard#
These two features are often confused because both talk about margin. The difference is the verb.
Use COGS & Margins to understand and price; use Margin Guard to stop the bleeding on a metric you've already decided must never run below a floor. They share the same margin formula, so a guard you set will line up with what this dashboard reports.
Troubleshooting#
What's not here yet#
Being clear about the edges saves you a support ticket:
- Forecast and what-if are computed server-side but not yet surfaced as their own screens — today the dashboard reports actuals, not projections.
- Break-even volume needs a fixed-cost basis to divide against; until you supply one, unit economics reports per-event cost, revenue, and margin without a break-even point.
- The Unclassified bucket only shrinks as upstream event sources start shipping the cost split — Aforo won't guess a decomposition it wasn't given.